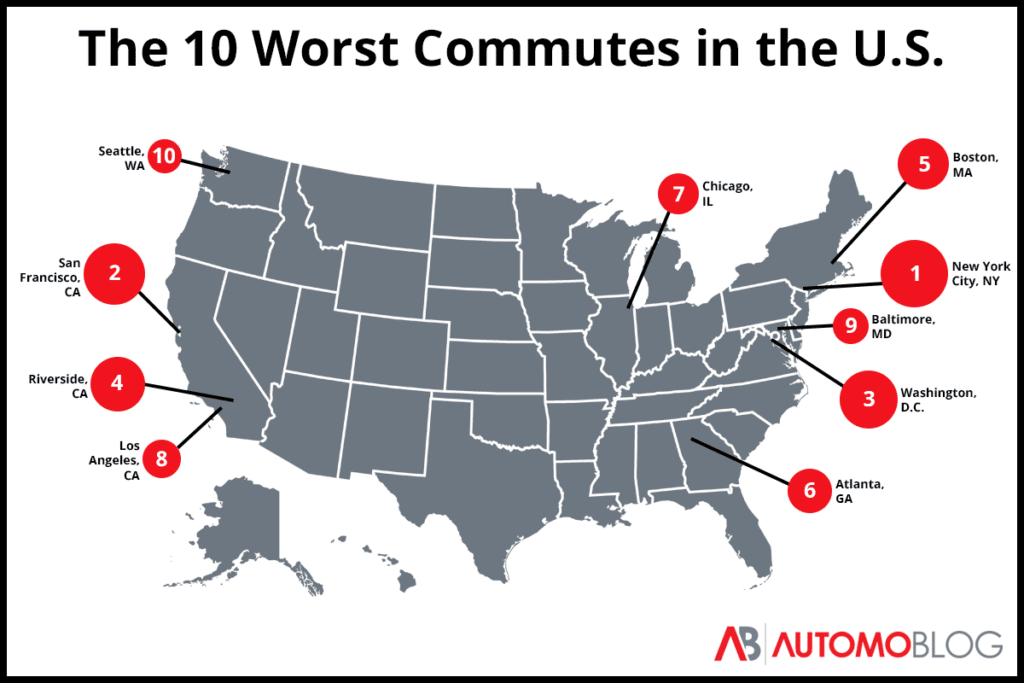
The 10 Worst Commutes in the U.S.

Commuting can be a challenge no matter where you live ? but urban sprawl, local geography, a lack of city planning, and other factors can make the drive to and from work particularly painful in specific locations.
In 2021, the average American worker spent 52.6 minutes per day commuting round-trip, according to data from the U.S. Census. And while that equates to nearly four-and-a-half hours per week, or 225 hours per year, that?s just the average. Drivers in many cities have it much worse. Our research team used the 2021 Census data to identify the top 10 U.S. cities with the worst commutes.
Drivers in These U.S. Cities Have the Worst Commutes
Driving to and from work isn?t fun anywhere, yet there are some areas of the country where conditions may seem custom-made for nightmarish gridlock. We used a number of data points to create a “Commute Hardship Score” that reflects the overall difficulty of a commute in each city on a 100-point scale.
Drivers in the following 10 cities hopefully have a lot of music or podcasts they enjoy listening to, because they?ll need something to fill some of the worst commute times in the country.
1. New York City, New York
Commute Hardship Score: 95.7
Drivers in and around The Big Apple probably won?t be surprised that the New York City metropolitan area landed in the top spot on this list. At 33.7 minutes each way, drivers in and around the five boroughs face the country?s longest average commute. T...
| -------------------------------- |
|
|


